A UX Researcher, Writer and Consultant.
Boosting engagement for an AR exhibit
Discover how I utilized experimental research and wizard of oz to create an interactive exhibit featuring a globe that visualizes large-scale data, leading to a significant increase in user engagement.
Methods
Experimental Research,
Wizard of Oz,
Embodied Schema Development
Tools
Figma,
Qualtrics,
Python, Unity
Timeline
8 weeks

Background
Partnering with a museum, the lab aimed to create an exhibit that would not only educate visitors about critical global issues but also engage them in a meaningful and interactive way.
The IU AR Embodied Interaction Lab specializes in researching and developing advanced interactive technologies that enhance user experiences through augmented reality (AR).
Problem Statement
The primary objectives of this project were to evaluate the effectiveness of gesture-based interactions, enhance user engagement, and improve the overall usability of the exhibit. This involved quantifying changes in
user interaction frequency
time spent exploring the globe
satisfaction levels with different gesture sets
Methodology
Experimental Research
Wizard of Oz Research
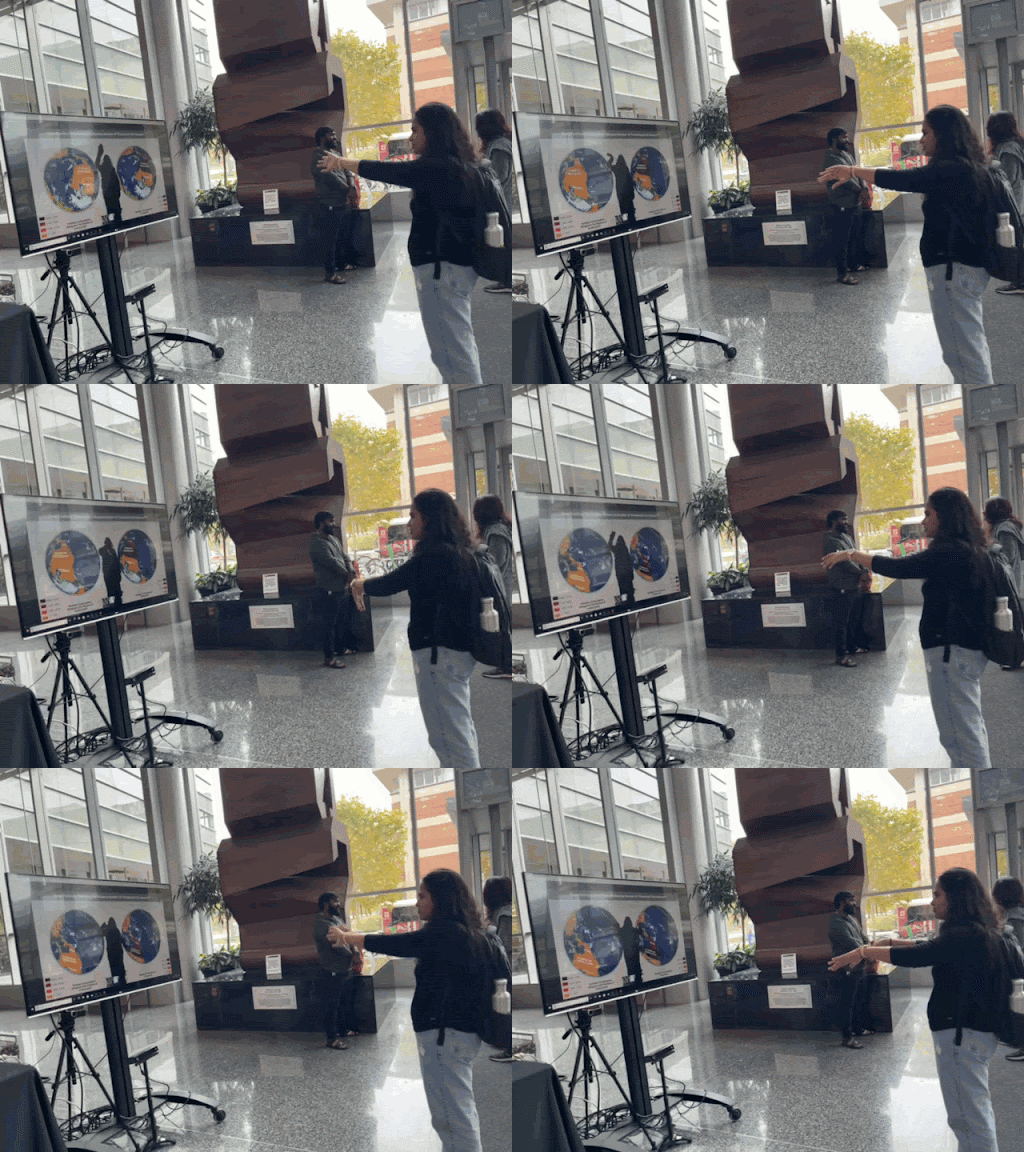
Two sets of gestures were tested with users to determine their effectiveness in interacting with the globe. Set 1 included initial gesture designs, while Set 2 featured alternative gestures. Users explored the globe and its data visualizations using these gestures to assess their impact on engagement.
A Wizard of Oz approach was used to simulate and test gesture interactions.
We controlled system inputs to mimic user gestures, allowing for real-time adjustments and refinements to gesture mappings based on observed user behavior and feedback.
Embodied Schema Development
Based on research findings, a set of refined gestures was developed to facilitate intuitive interactions with the globe. These gestures were designed to enhance user control over actions such as zooming and rotating the globe, aiming to improve the overall user experience.
Participants
The study recruited a diverse sample of 100+ participants, comprising museum visitors aged 18-65. This group included both frequent museum-goers and first-time visitors, ensuring a mix of familiarity with museum exhibits. By including both frequent museum-goers and first-time visitors, the study aimed to gather insights from individuals with varying levels of comfort and experience with interactive exhibits.

Data Analysis
Data analysis was conducted to evaluate the impact of refined gestures on user engagement and satisfaction. The key metrics analyzed were interaction frequency, time spent exploring the globe, and user satisfaction.
Interaction Frequency: ANOVA testing showed a significant increase in interactions with the refined gestures, averaging 7 interactions per session in the experimental group versus 5 in the control group, a 28-30% improvement (p < 0.05).
Time Spent: A T-test revealed that users spent an average of 13 minutes with the refined gestures, compared to 10 minutes with standard controls, representing a 30% increase (p < 0.05).
User Satisfaction: Post-interaction surveys rated on a 1-5 Likert scale showed a mean satisfaction score of 4.0 for the refined gestures, versus 3.2 for the control group, reflecting a 25% increase (p < 0.05).
Qualitative Feedback: In addition to quantitative metrics, qualitative feedback was analyzed from open-ended survey responses and observational data.
Tools used


Initial Gestures Set
Developed initial concepts for gesture interactions, focusing on ease of use and intuitiveness.

User Personas
Based on research, three primary personas were created to represent the different types of visitors:

The Player Paris
Paris is a tech enthusiast who enjoys exploring cutting-edge technologies, particularly in interactive and immersive experiences.

The Curious Explorer
A frequent museum-goer eager to dive deep into educational content and interact with exhibits.

The Casual Observer
A first-time visitor with a general interest in learning but limited experience with interactive technology.
Personas guided the design and refinement of gesture interactions, ensuring they catered to the diverse needs of museum visitors.
Created detailed journey maps for each persona to visualize their experience at the museum and interaction with the AR exhibit.

These UX assets played a critical role in driving the design process, ensuring that the final AR exhibit was not only educational but also highly engaging for a wide range of museum visitors.
Results
28-30% increase in interactions with refined gestures
-
7 interactions per session vs. 5 in the control group, p < 0.05
30% increase in time spent using the refined gestures
-
13 minutes vs. 10 minutes with standard controls, p < 0.05
Post-interaction survey revealed 25% improvement in satisfaction with refined gestures
-
mean score of 4.0 vs. 3.2 in the control group, p < 0.05
Implementation
The refined gestures were integrated into the AR exhibit and deployed to museum visitors. This deployment involved ensuring that the gestures were intuitive and effective for interacting with the globe.
Promotional efforts were made to highlight the new features, and user interactions were closely monitored to gather feedback and data.

Impact
The project demonstrated that well-designed gestures can significantly improve user interaction, time spent, and satisfaction in interactive exhibits. The findings support the continued development and optimization of gesture-based interfaces for enhanced user experiences.
boosted user engagement by 30%
through gesture-based interactions

